Pulse Parameter Analysis
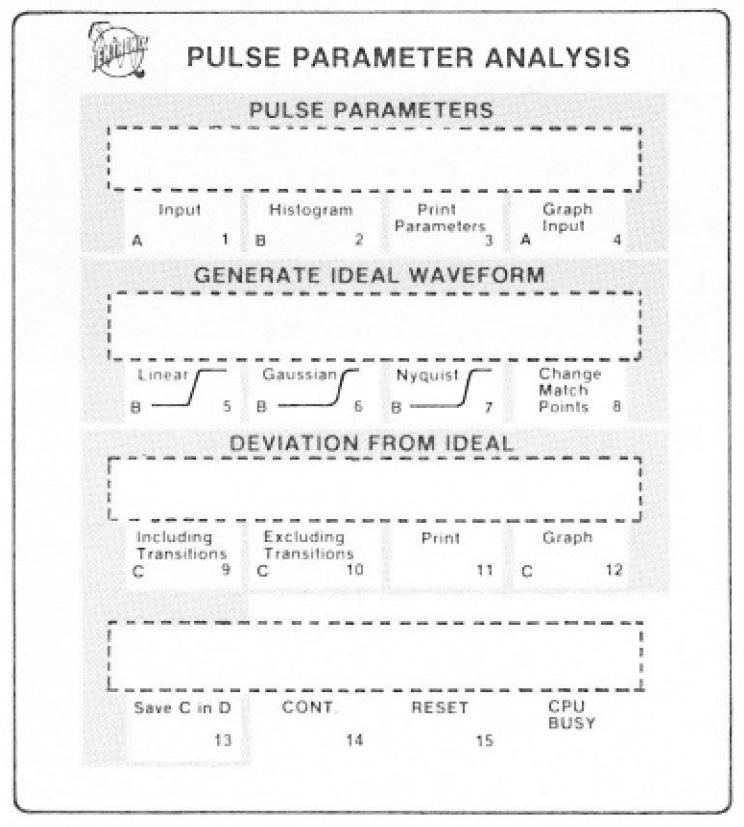
From a modern point of view, the calculation of pulse parameters such as rise or fall time is nothing special. They are performed automatically by almost all oscilloscopes. But back then, in 1973, this was still one of the “killer applications” in digital signal processing.
The Pulse Parameters Program was one of the first programs which were released for the DPO by Tektronix (CP75211/CP75281). It was also used as an example in the operator’s manual of the P7001. These two reasons lead to my decision to recreate this program in the controller portion of the P7001 USB Interface.
This page will not cover on how to use the program. That’s described in the user manual 070-1883-00. A nice picture gallary of the program can be found at the vintageTEK museum. I will explain some points around implementing the original algorithm on the USB interface.
Execution speed
All the calculations of the original pulse parameter program could be done on modern hardware within a fraction of a second. This would even include all variations of all parameters. But I wanted this program to have the same look & feel as when it was new in 1973 - running in a BASIC environment on a DEC minicomputer.
For this reason I’ve internally adopted the original program line by line. I’ve also slowed down most of the calculations. As a result you can watch the waveforms being slowly building up and you have to wait 15 to 20 seconds before some of the calculations are finished.
Avoiding loop commands
One of the slowest command groups in DPO BASIC are loop operations like “FOR”. According to the original manual, a simple iteration over a an array with 512 items would have taken almost 15 seconds - without any further calculations of course. But with DPO Basic there was one exception: Array operations like multiplying each item of the array with a constant or multiplying two arrays were done directly by the underlying “operating system”. The programmers of the original Pulse Parameters Program did an amazing job to avoid almost any kind of BASIC based loops. A very impressive example is the way on how the dashed lines in the Pulse Parameters Program were created.
Creating a dashed line
The following code snippet creates a dashed line in waveform Memory C
2200 LET C=12.56: INTEGRATE C,C: LET C=SGN(SIN(C)+.6)-1
Let’s take a closer look on what’s going on.
LET C=12.56
This command initializes all items of Waveform Memory location C with 12.56. The result is a horizontal line. The number 12.56 determines the frequency of the dashed line.
INTEGRATE C,C
This command integrates the values of Memory Location C. The result is a rotated vector which is stored in Memory location C again.
LET C=SGN(SIN(C)+.6)-1
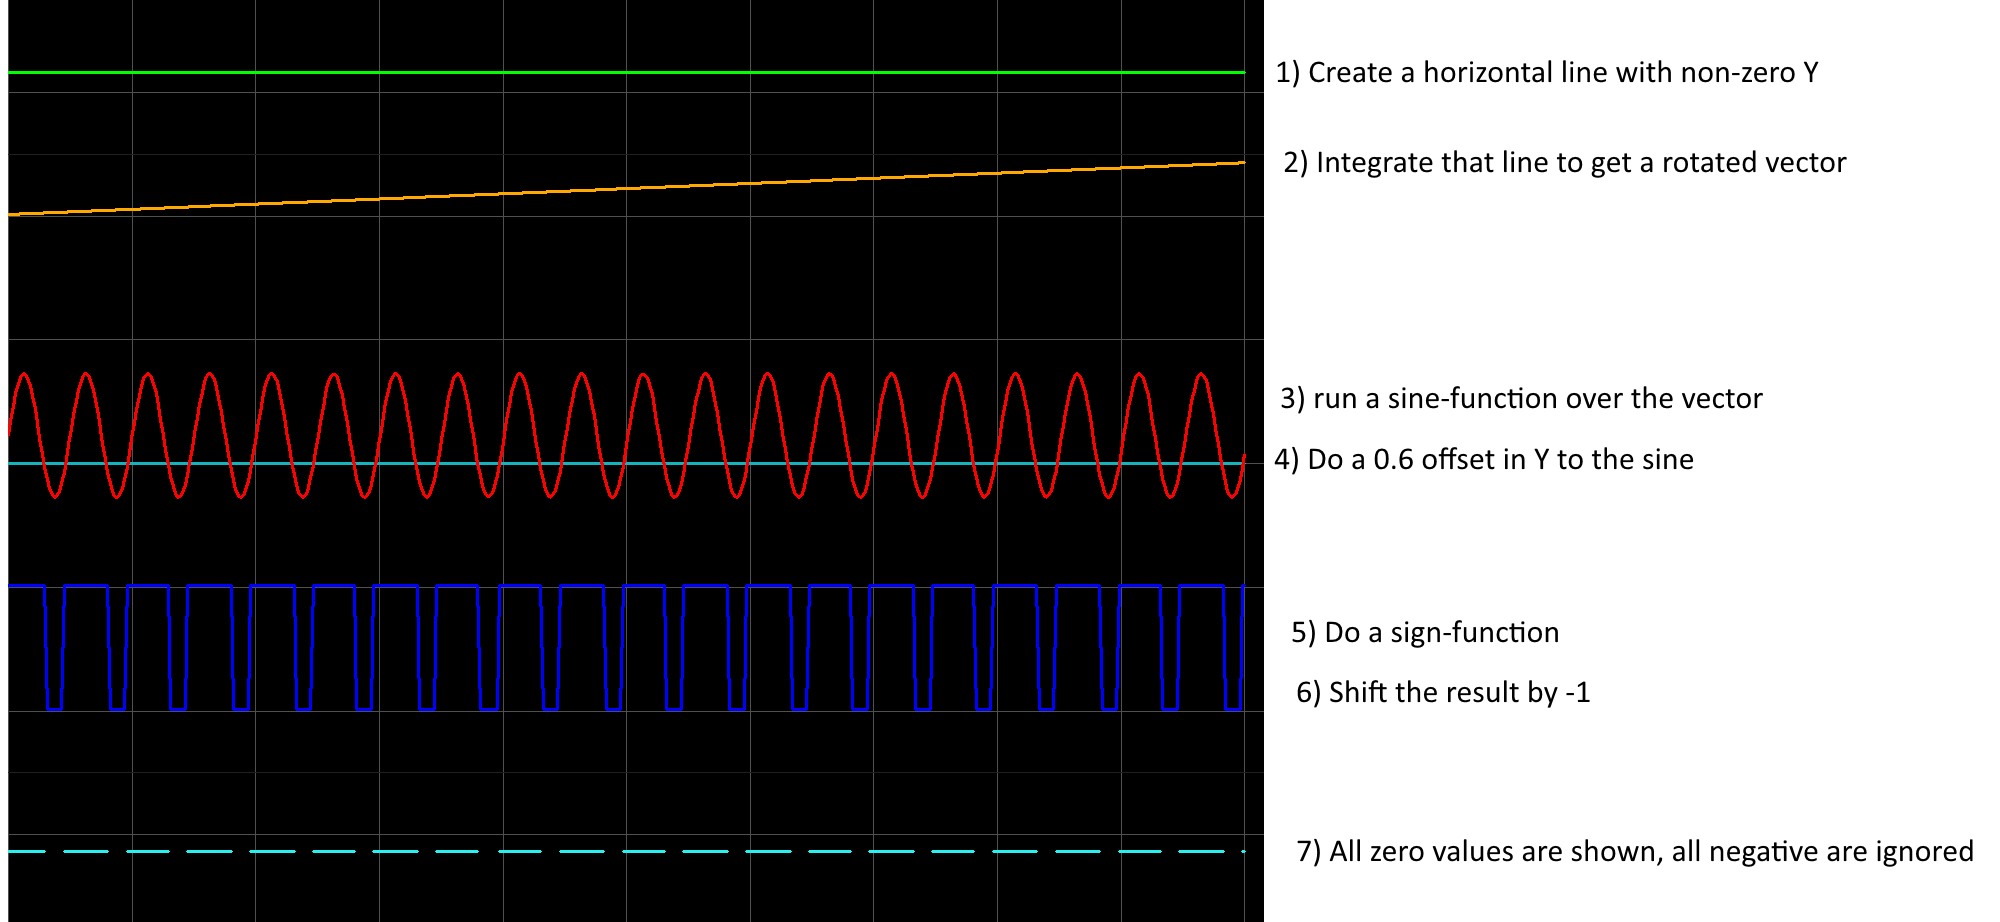
First the sine values of the rotated vector elements are calculated. The result is a sine curve. This curve is then shifted by 0.6 in the Y direction. A sign-function is applied and the last step is to shift the result down by -1.
The zero logic of the DPOs Display Generator takes care of the rest: all values below zero are automatically blanked - only the top portion of the curve is displayed: A dashed line.
This image visualizes the individual steps.
Impressions
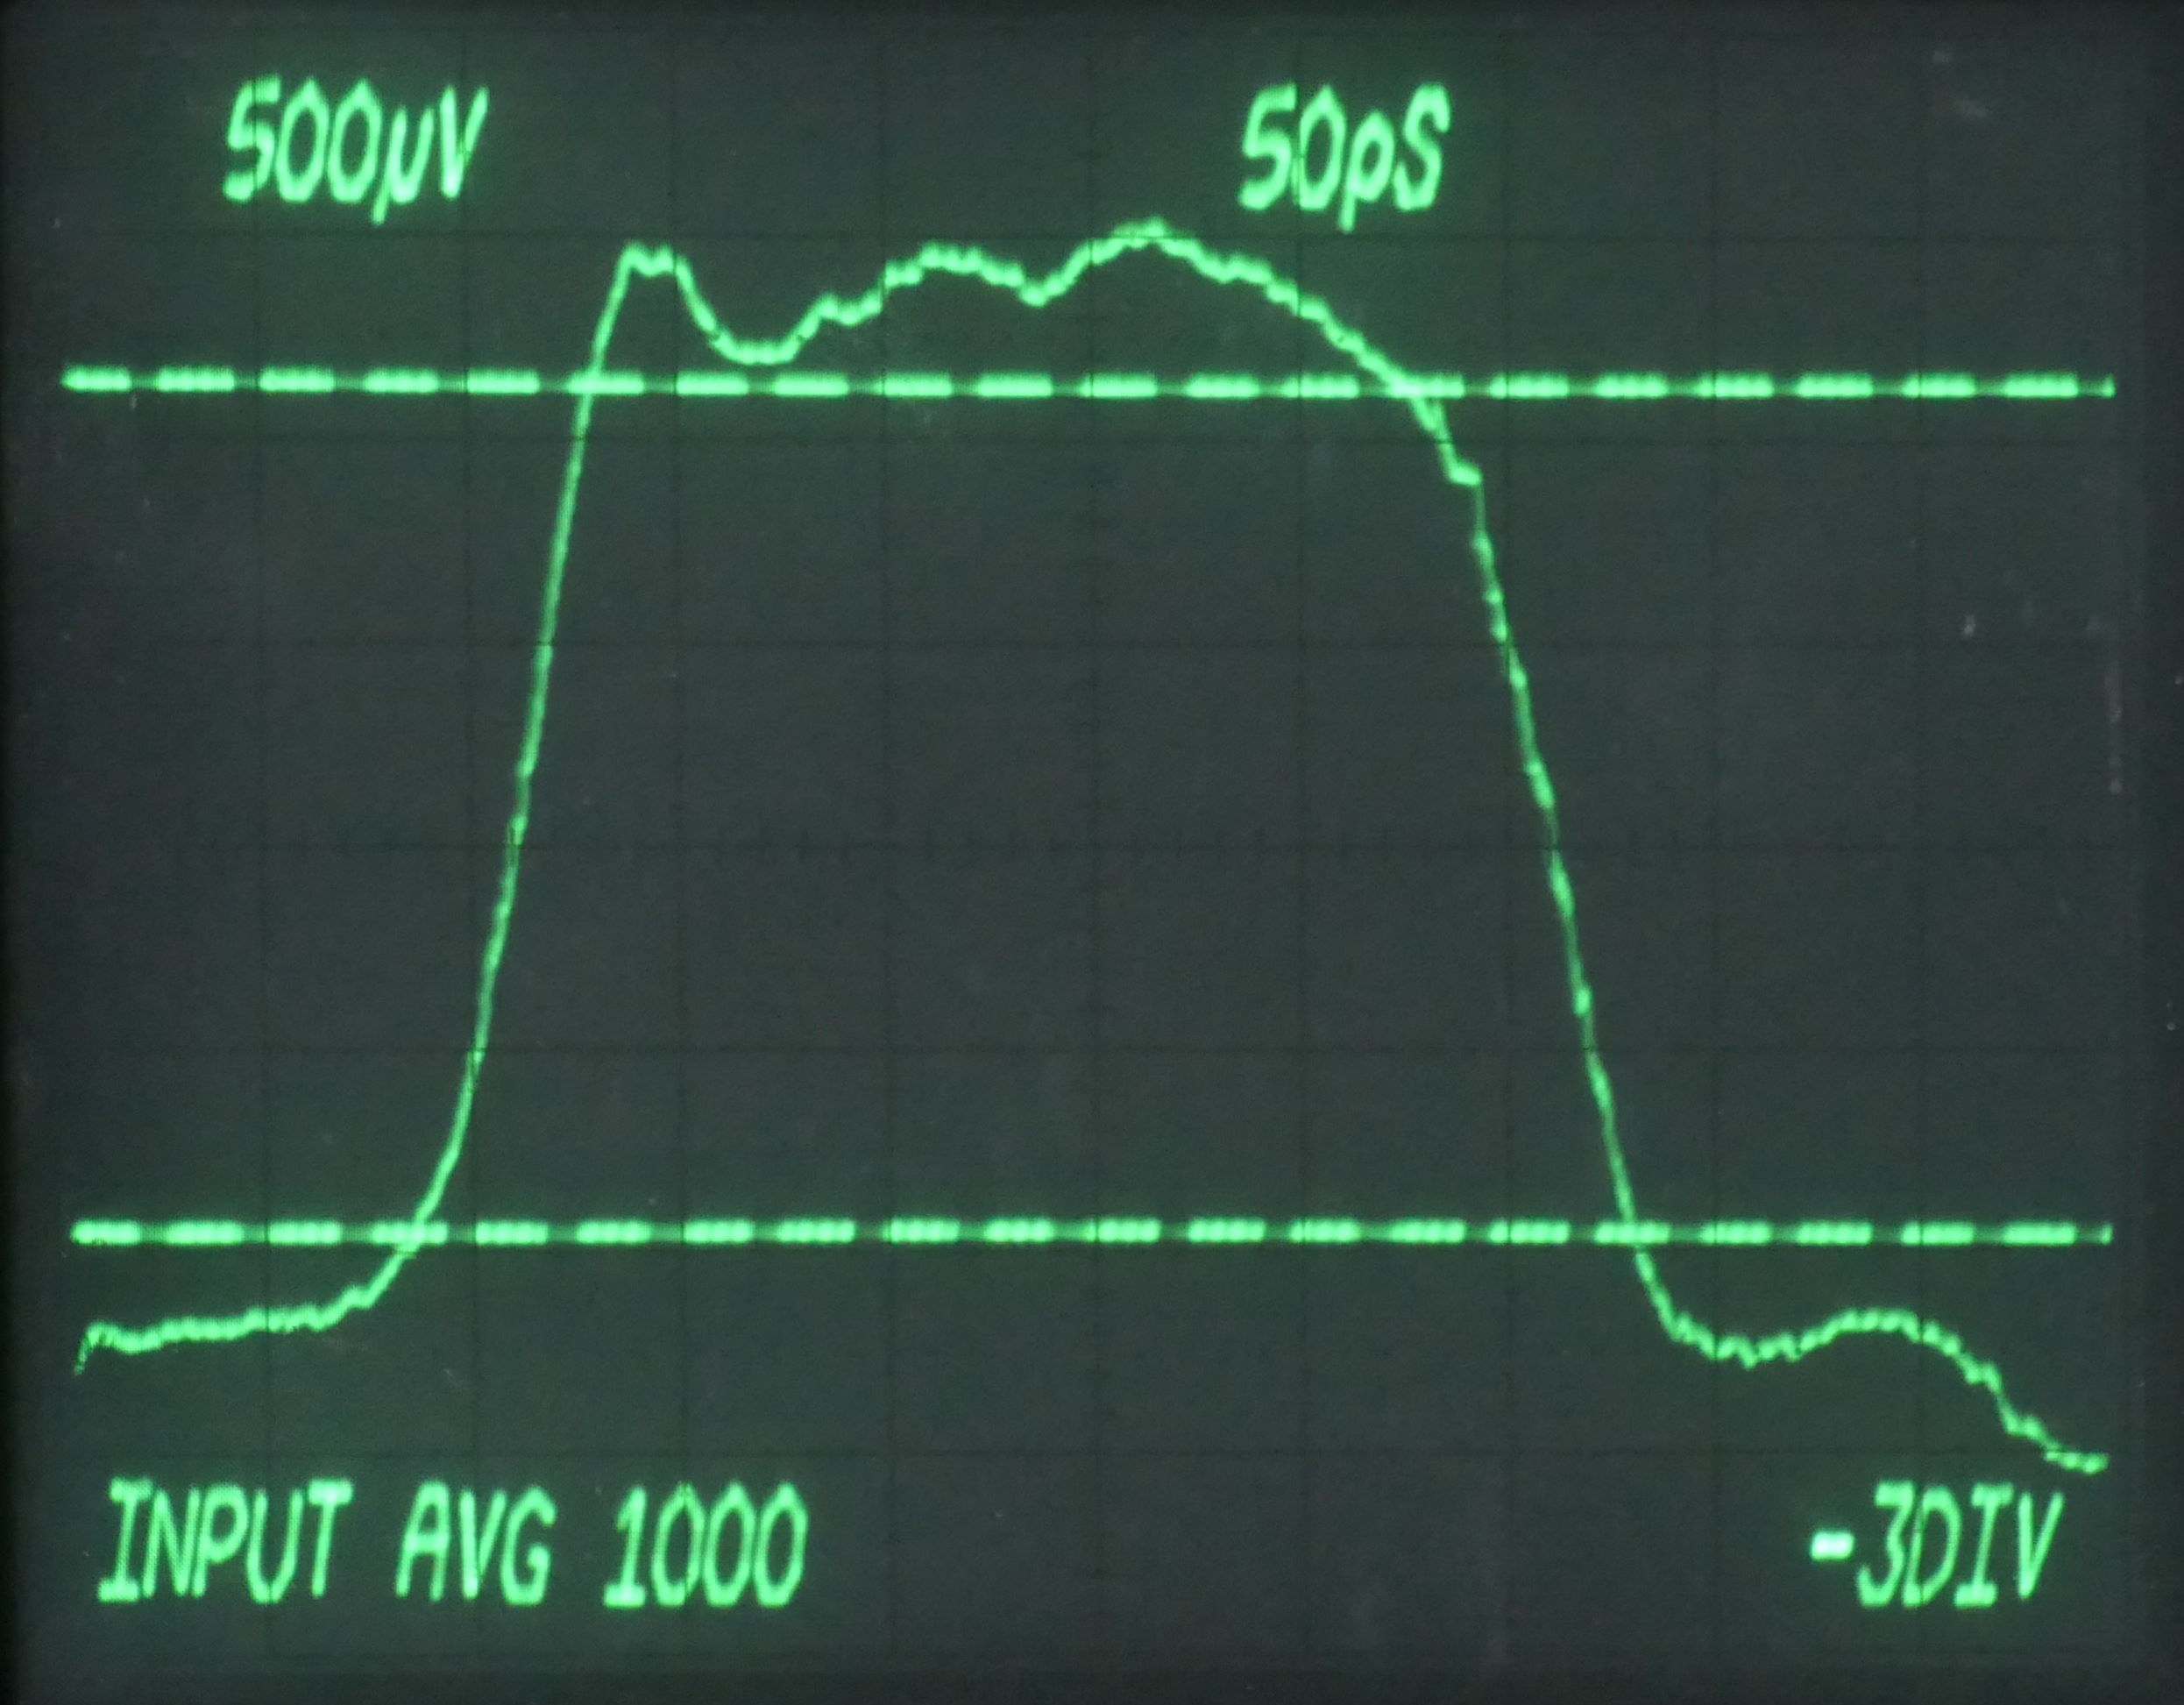
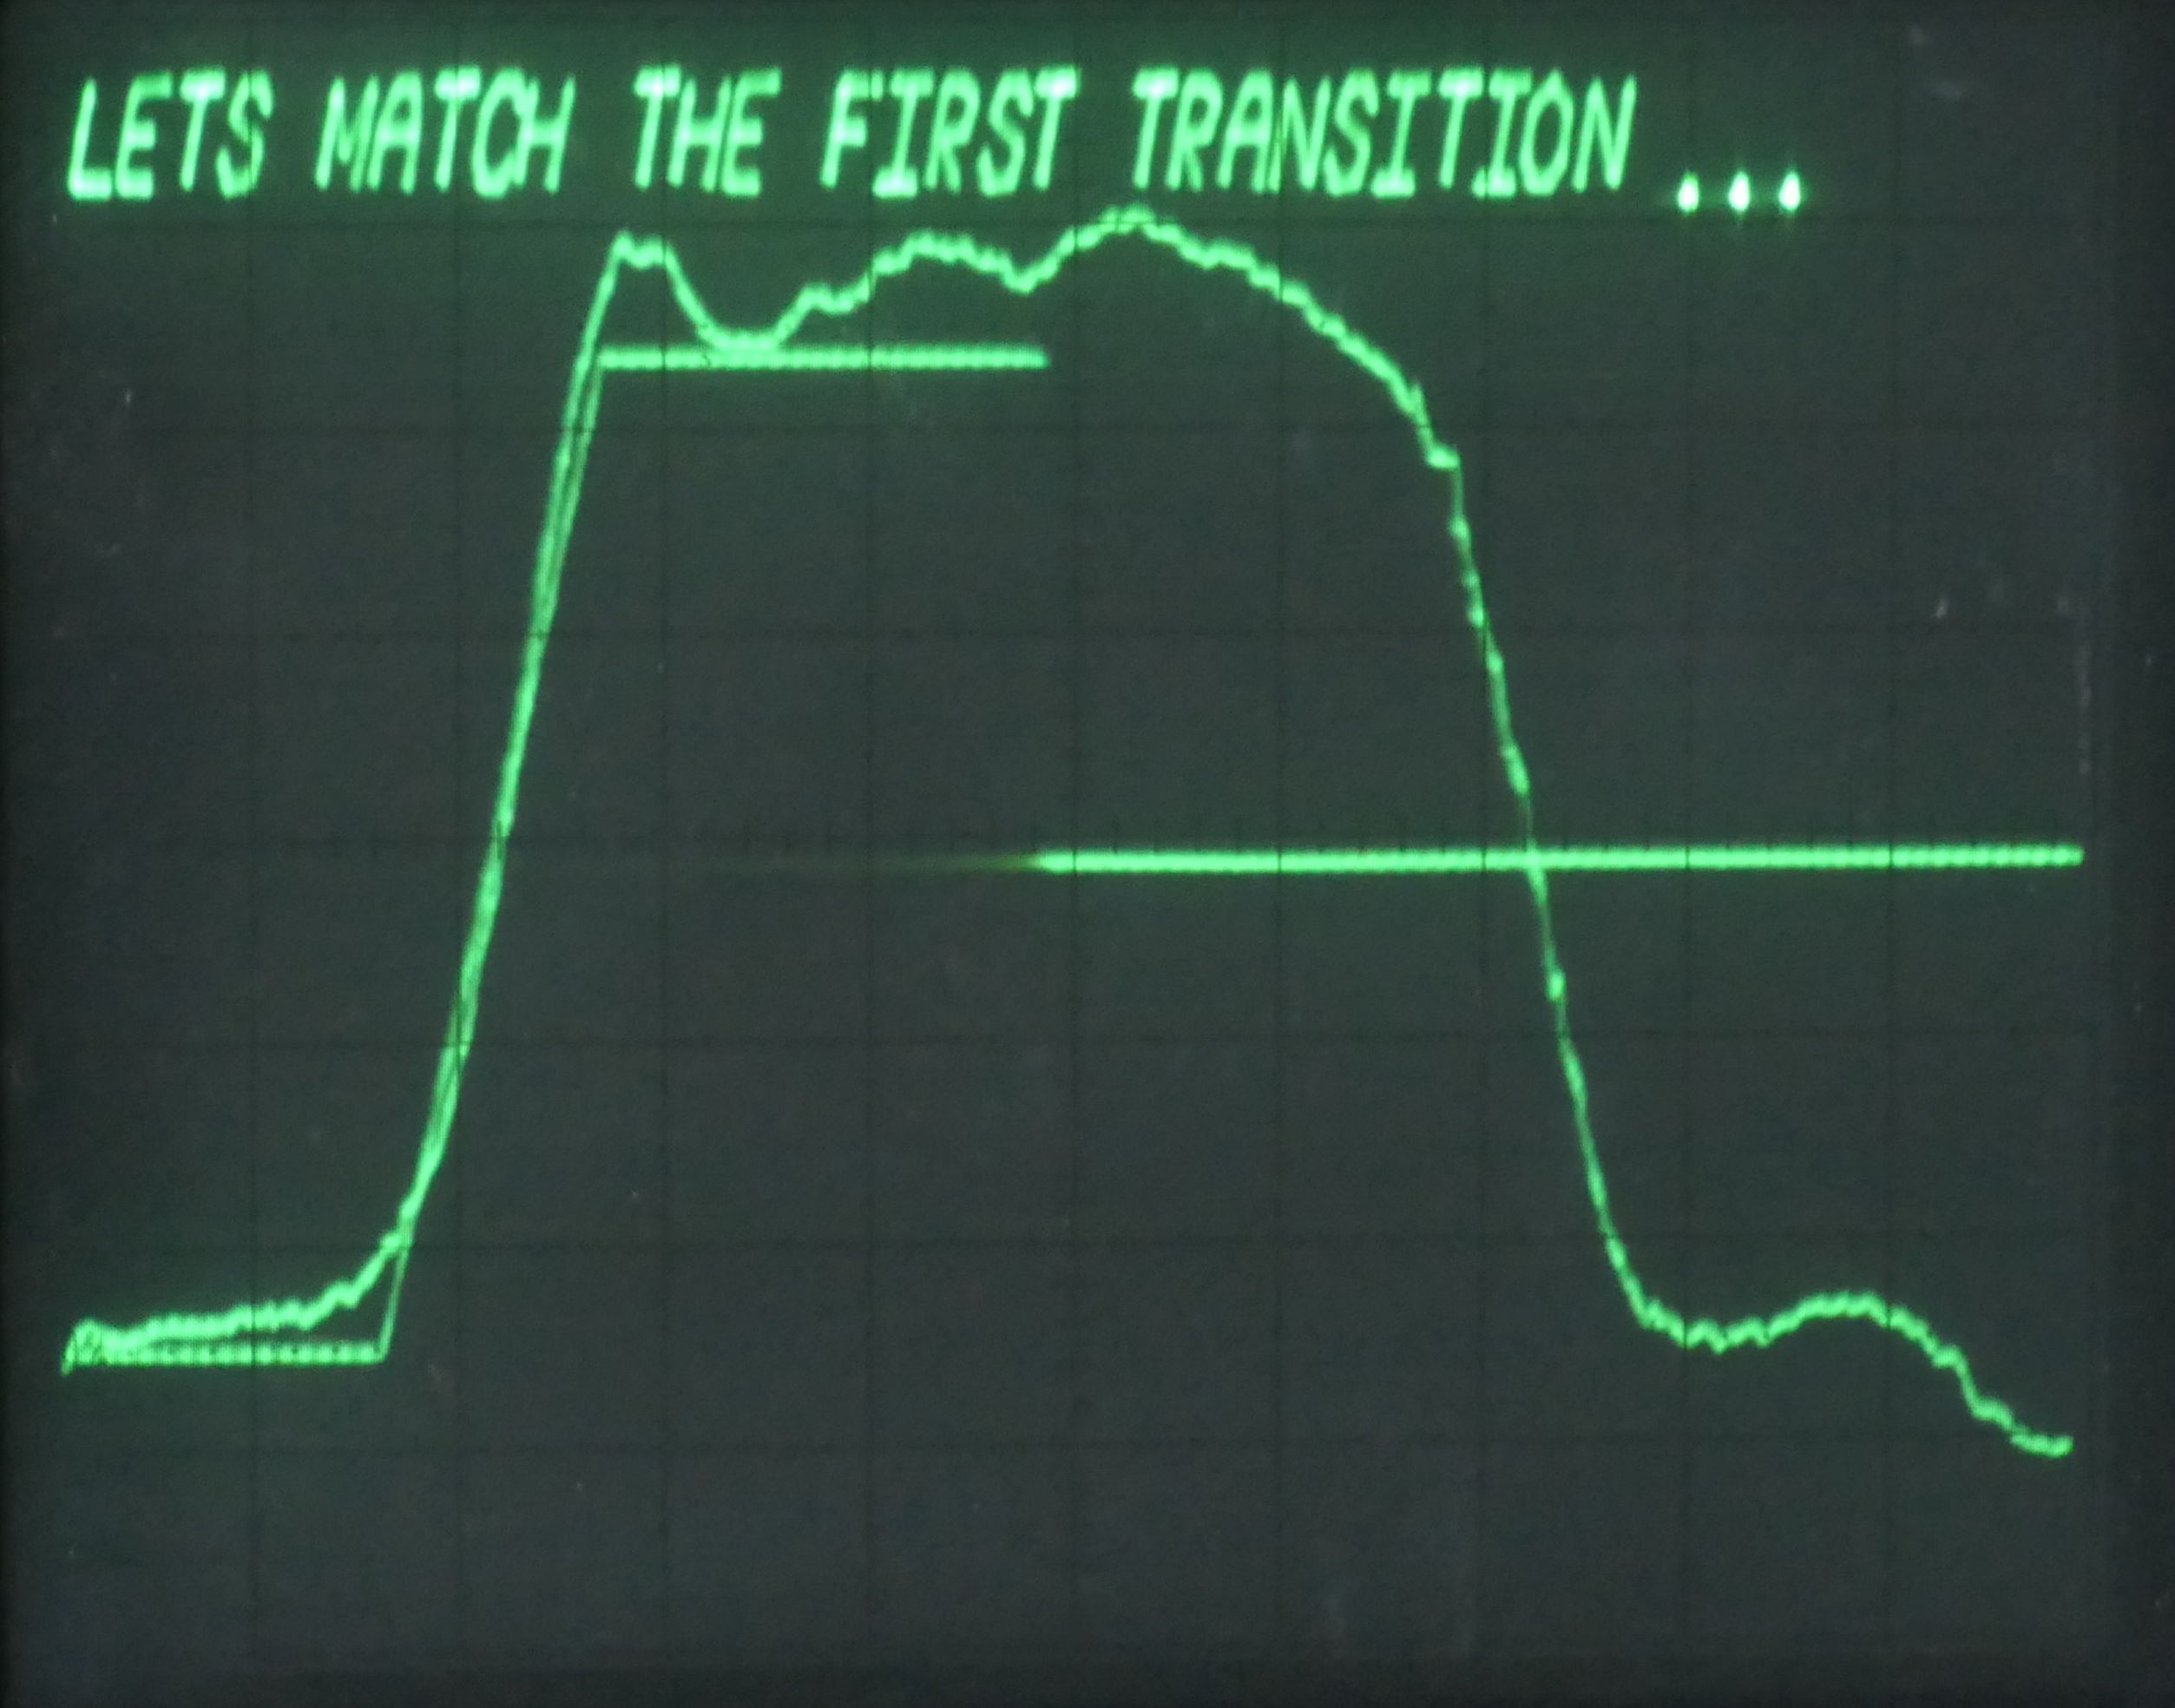
Input waveform with dashed lines at 10% and 90%
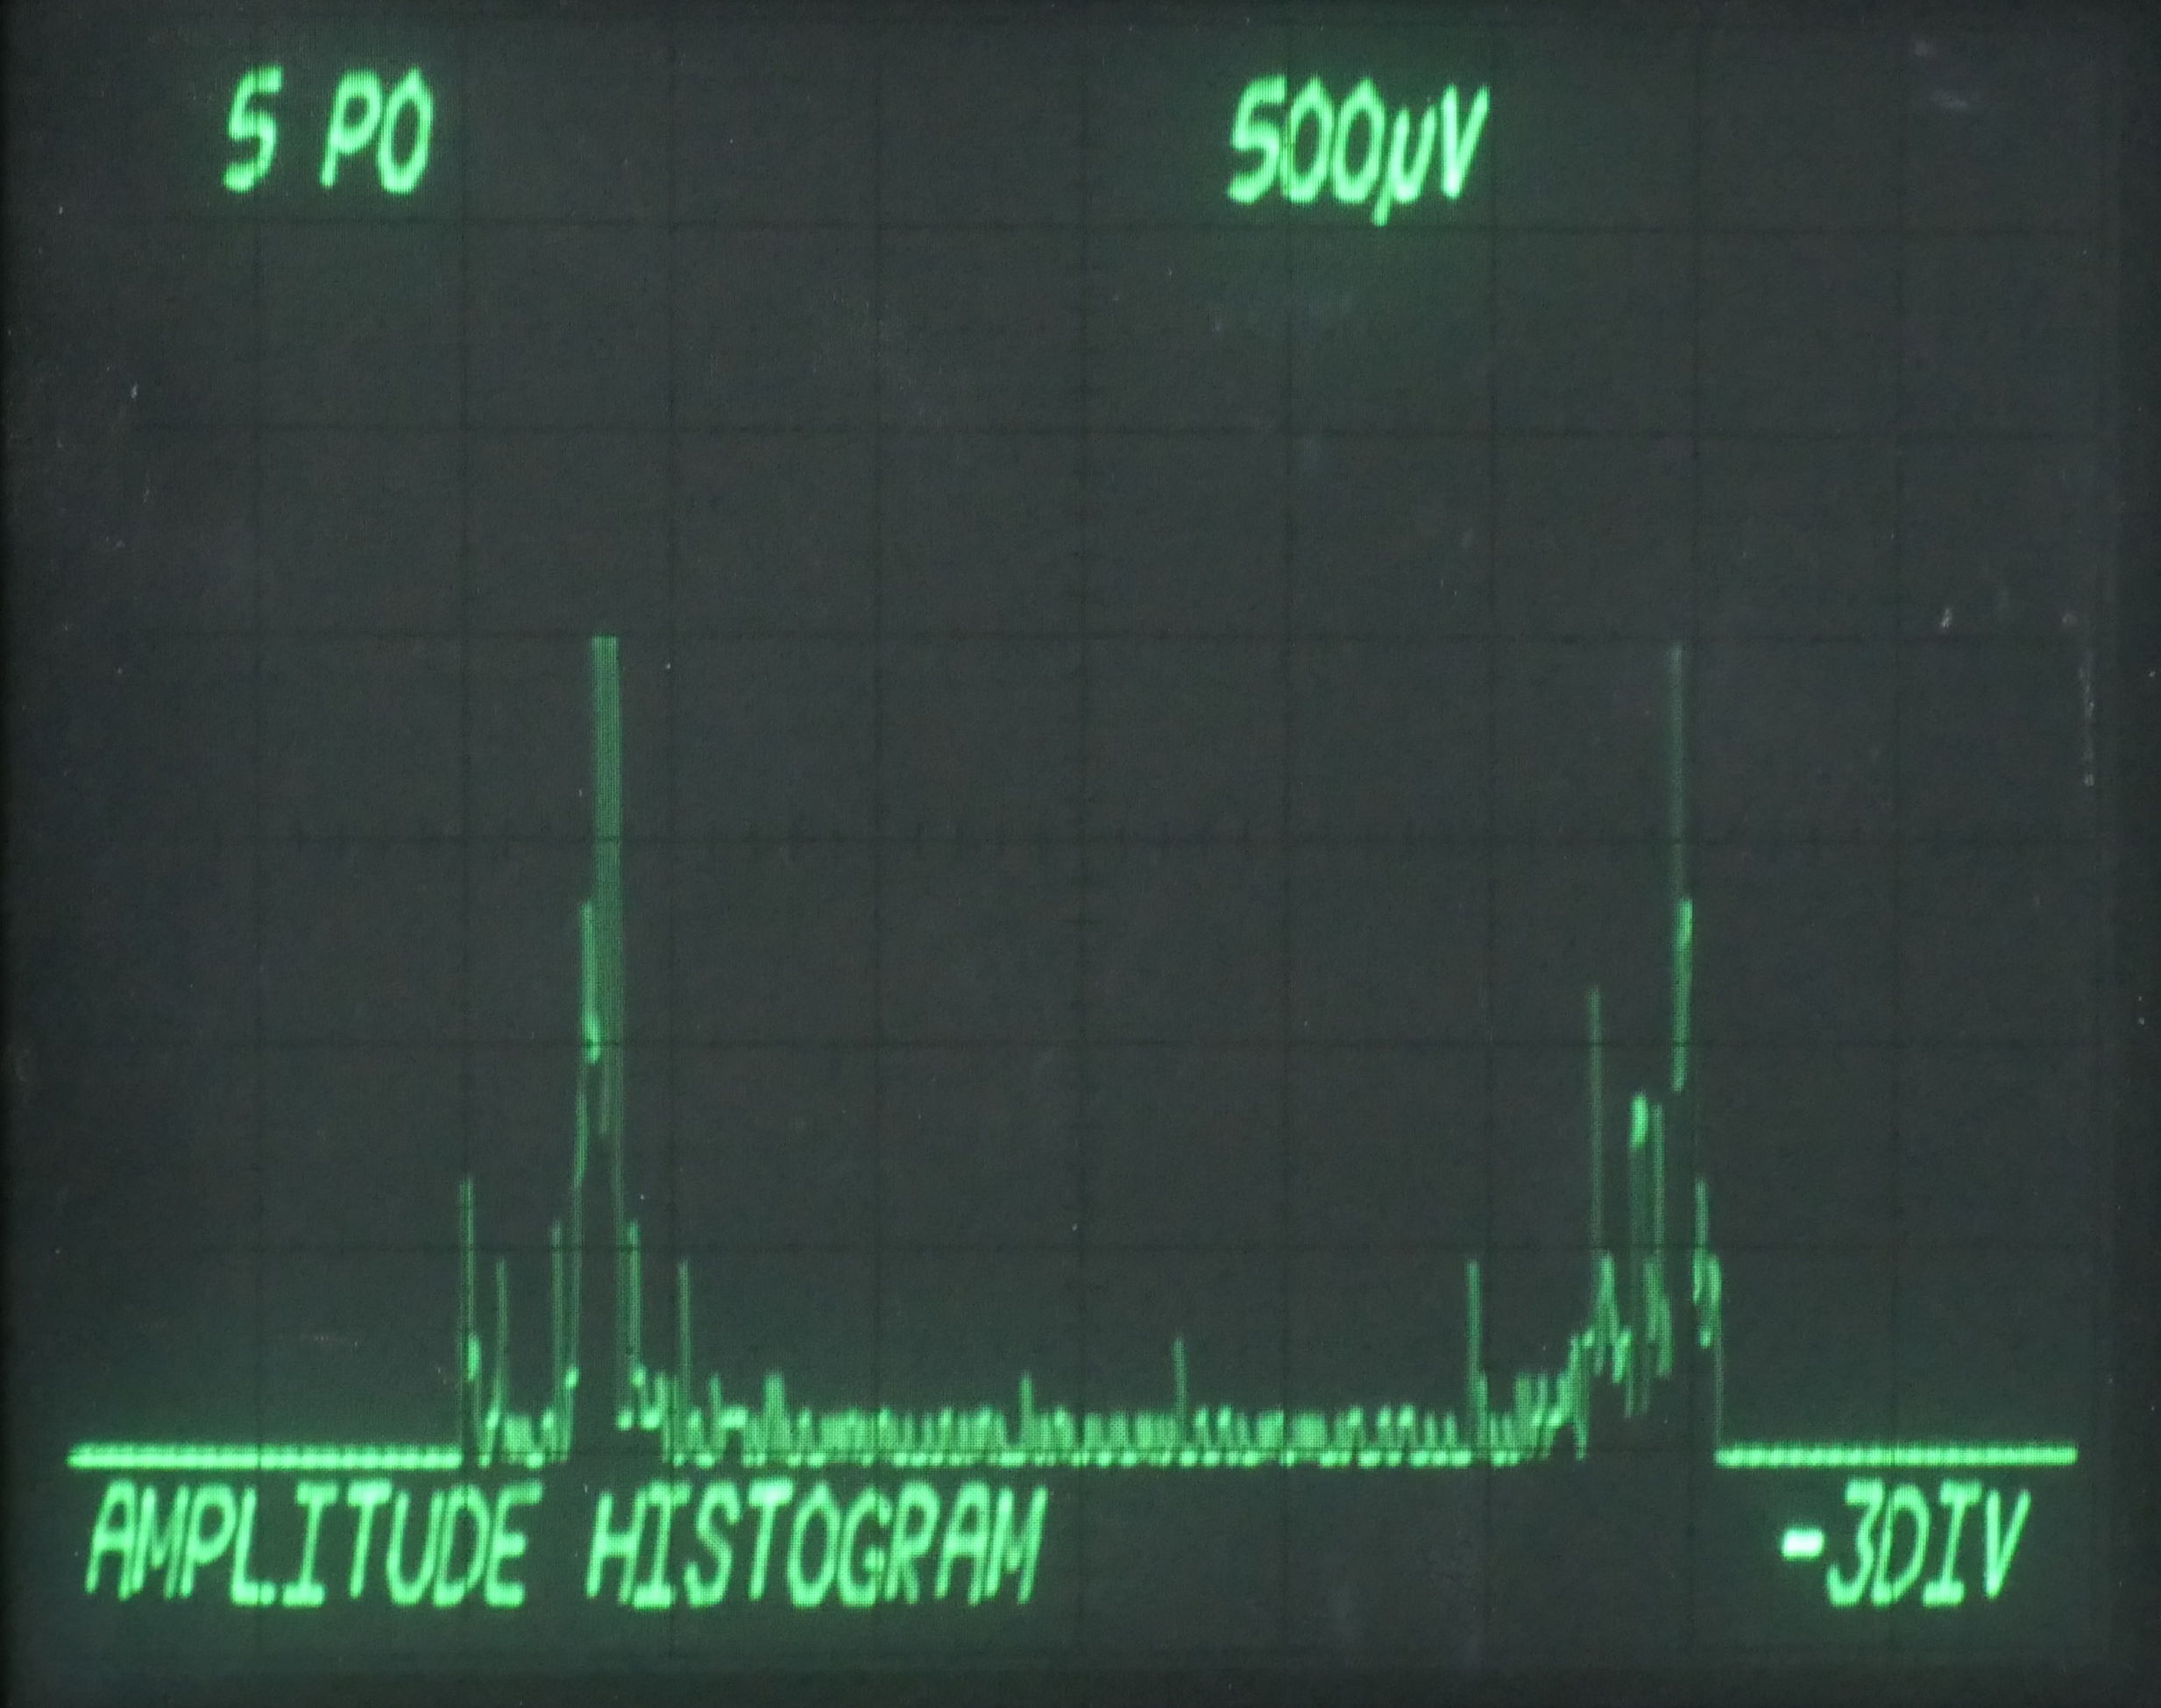
Histogram of input waveform
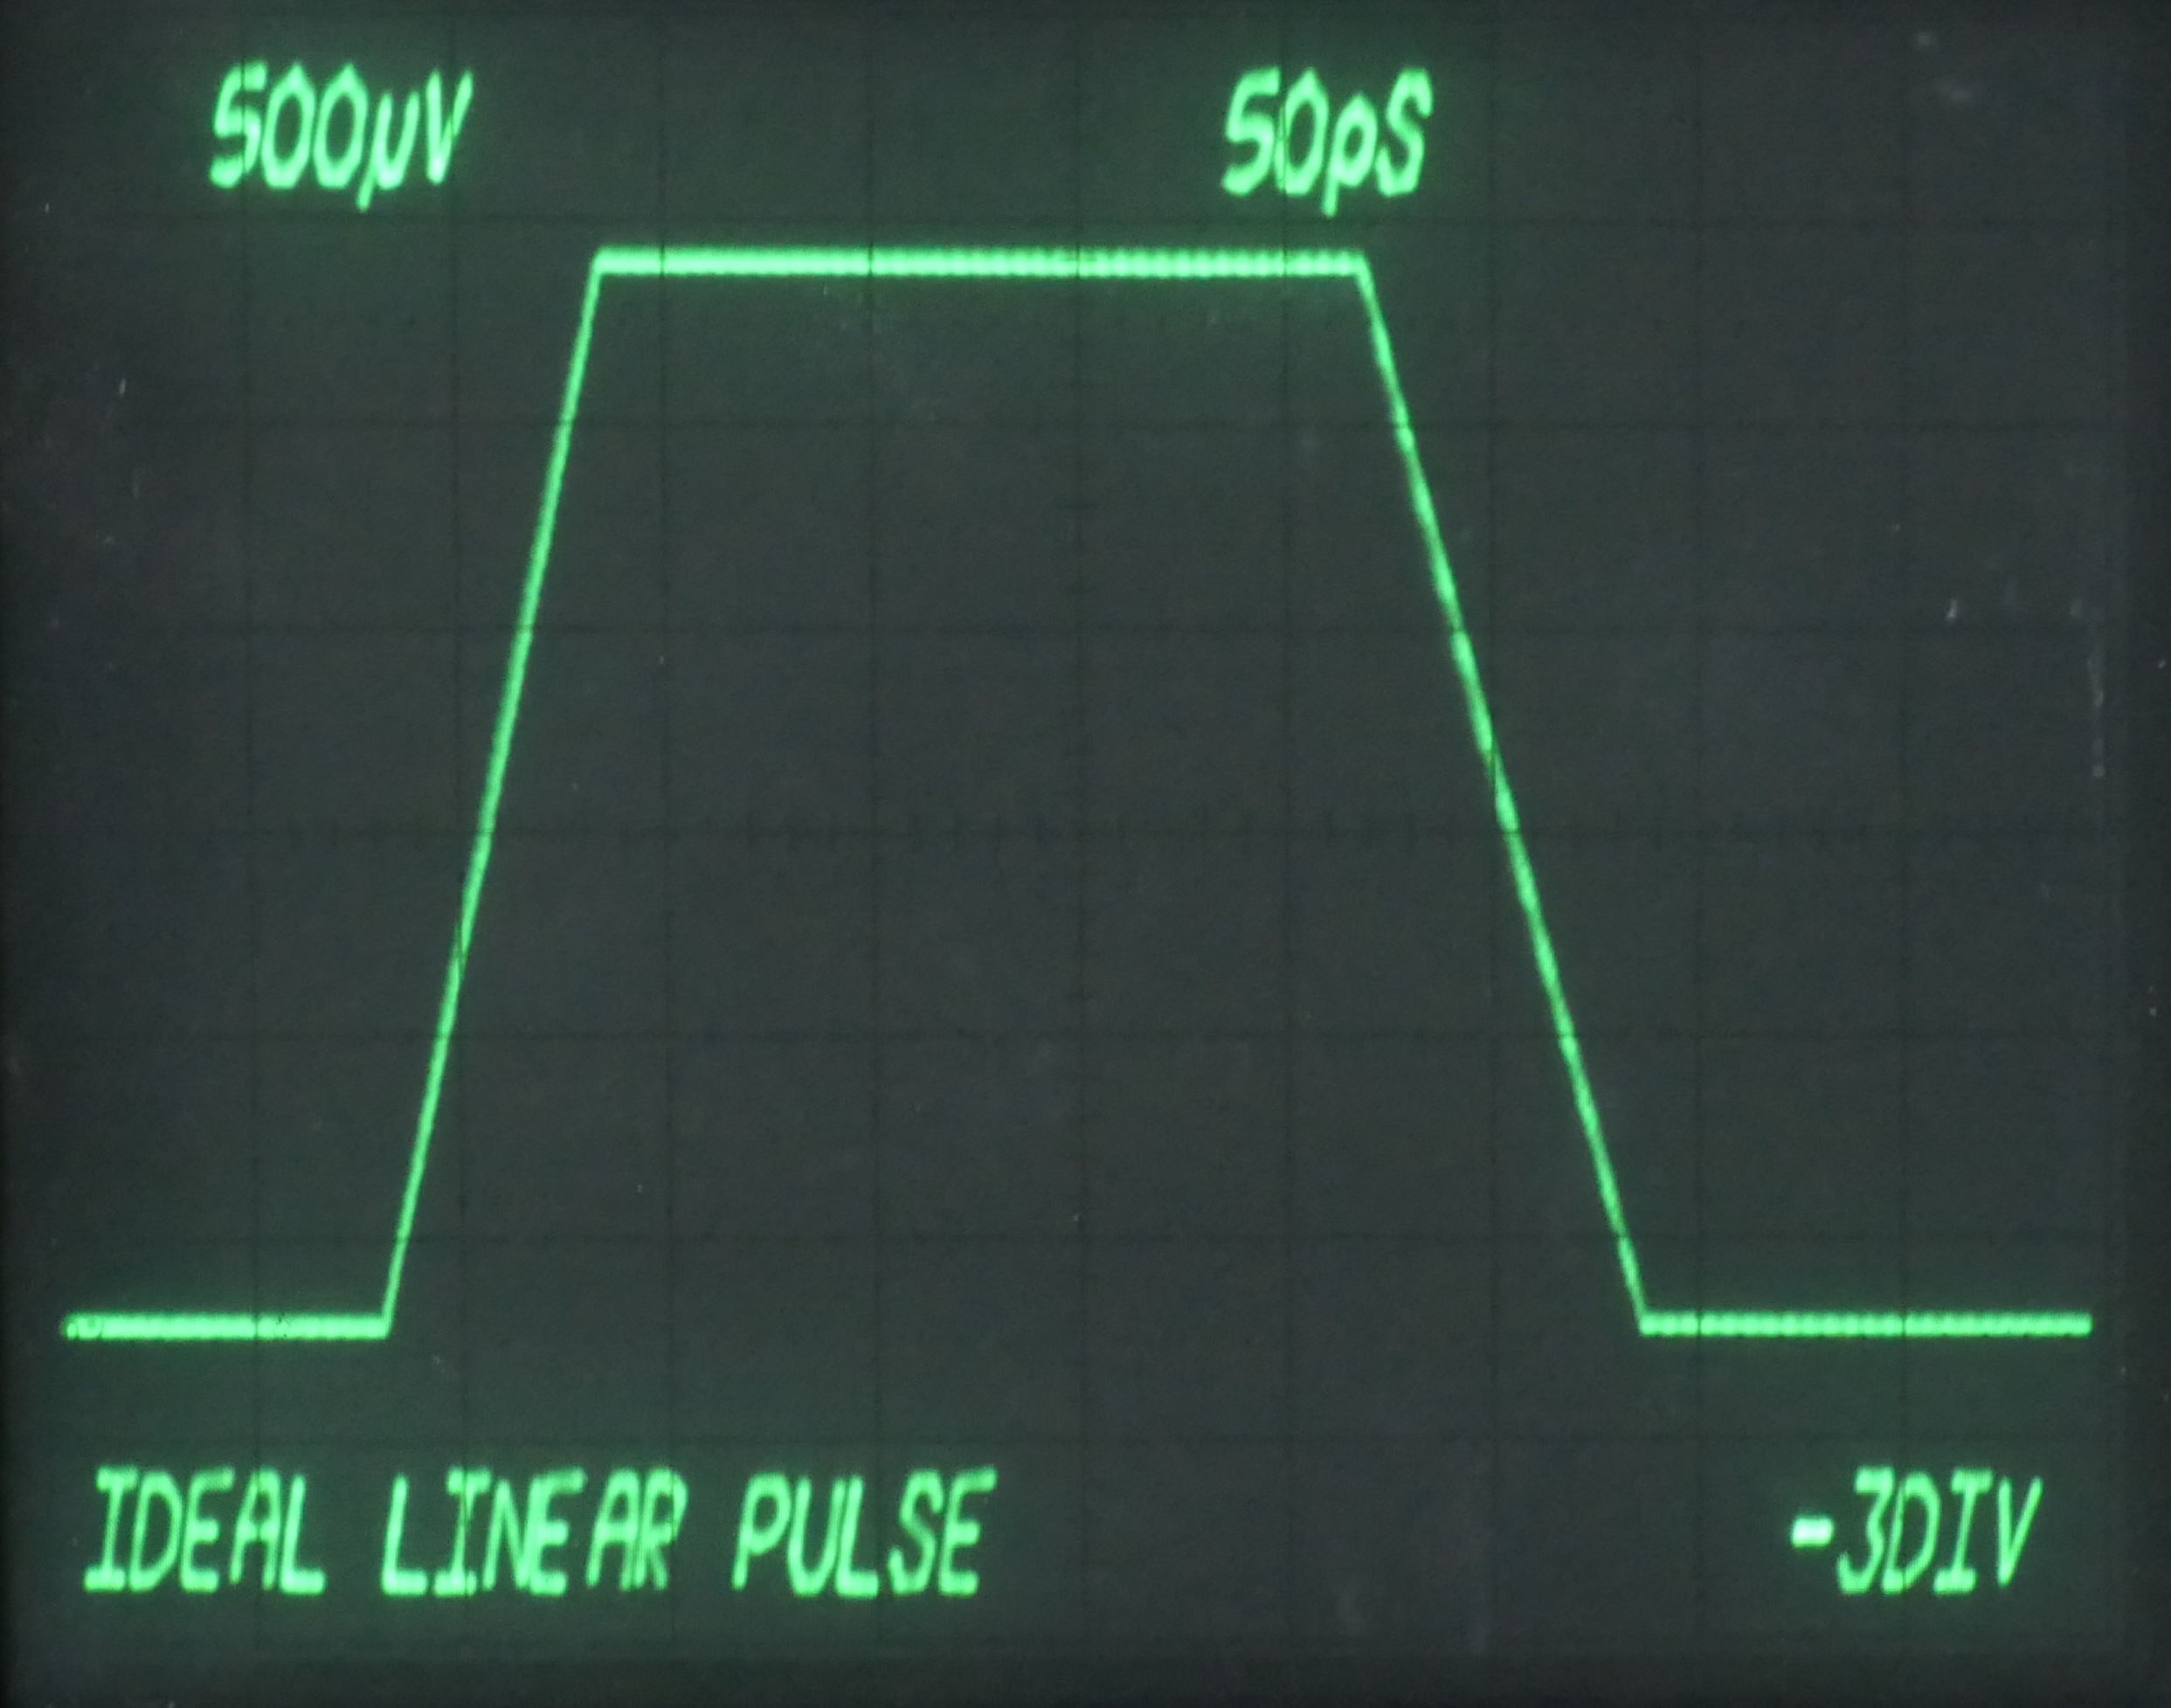
Calculated ideal linear pulse
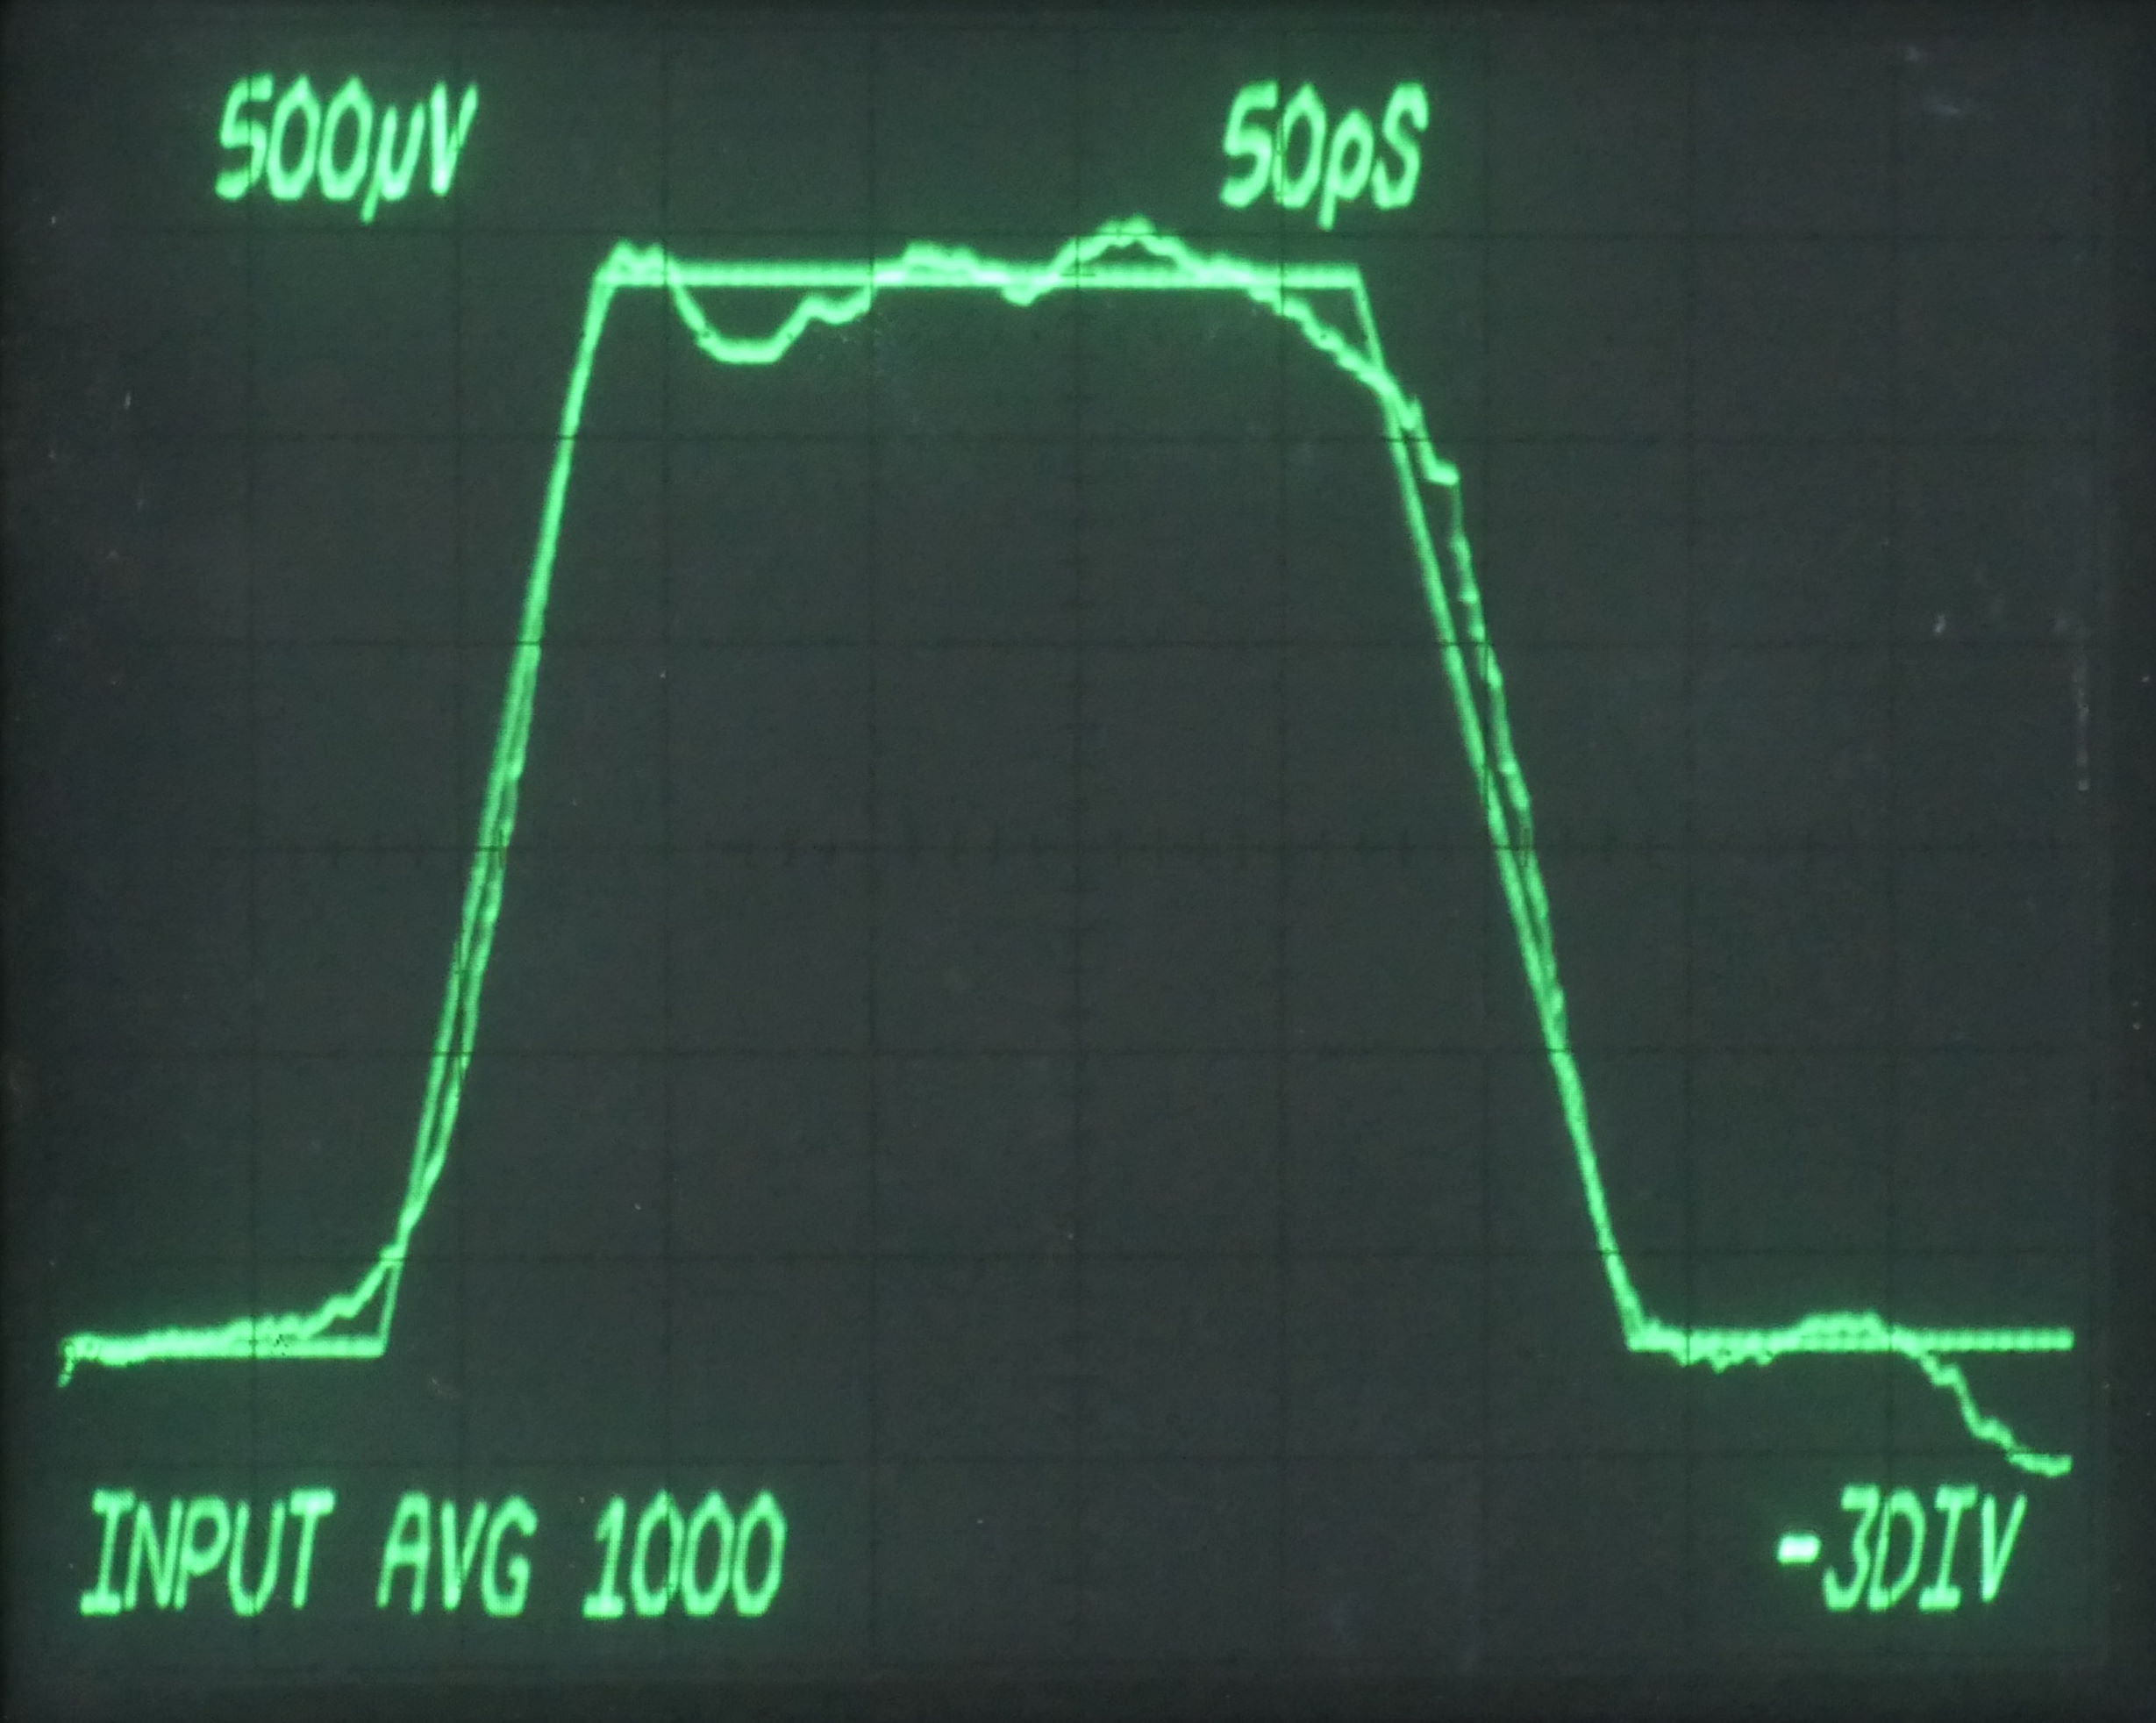
Comparison between original waveform and ideal linear pulse